
Articles like this and this cite data that seems to indicate Alabama prisons are on the right track. It’s true, the state decreased the prison populations through 2017, the result of a concerted, bipartisan effort that resulted in the 2015 Justice Reinvestment Act. While we are glad to see media outlets write about the prison overcrowding crisis, we want to take a moment to encourage journalists, along with every Alabamian, to look at the data after 2017 and consider the facts about Alabama’s prisons today.

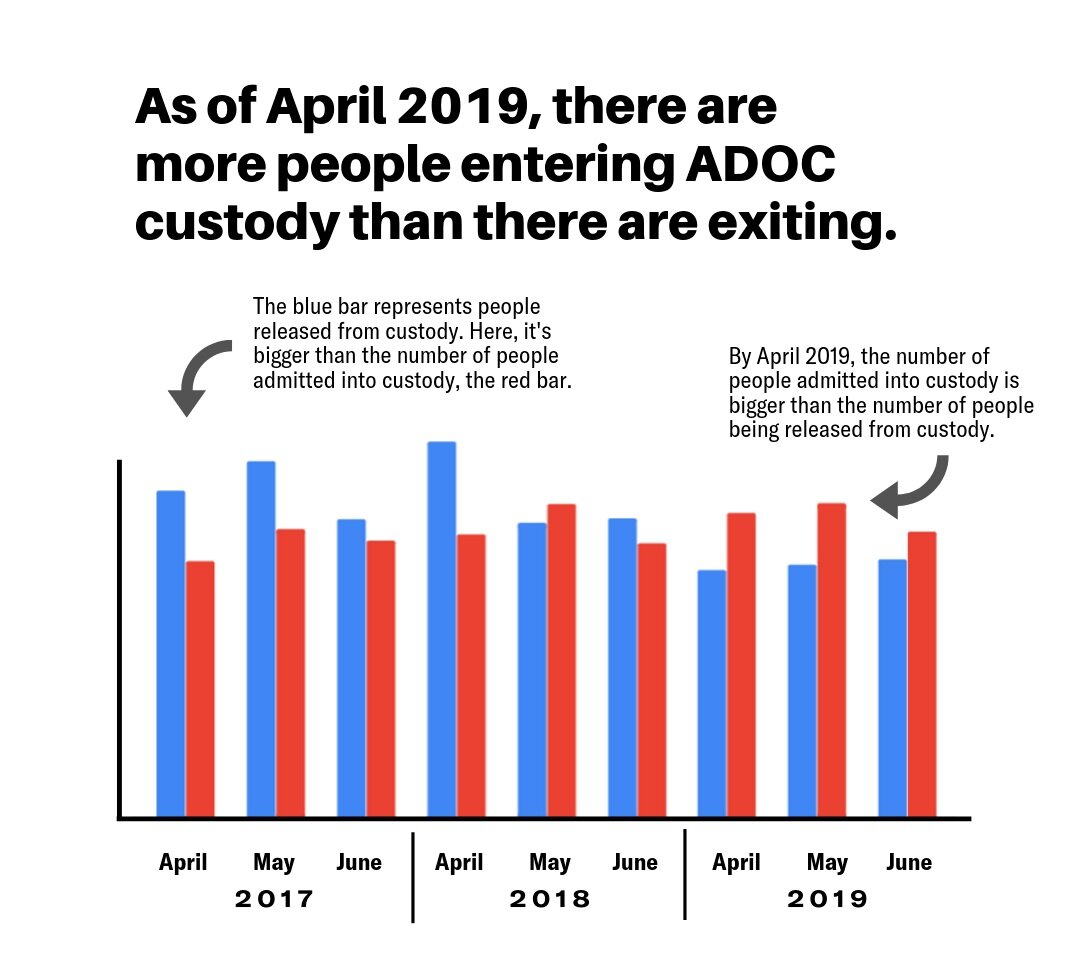
The Alabama Department of Corrections’ Monthly Statistical Reports, publicly available on the ADOC website, show that since October 2018, more people have entered Alabama prisons each month than have exited, marking the first time this has happened in the last five years. April 2019 was the first month since February 2013 that the in-custody population at ADOC was greater than the previous year with almost 300 more people in-custody in 2019 than in April 2018. Furthermore, total annual admissions increased each year for the past four years. We are headed in the wrong direction.
These trends are simply unsustainable. However, the data through 2017 does show that legislative reform can make a difference. That’s why our coalition of directly impacted people and policy organizations came together to demand that the state of Alabama act swiftly and boldly. Earlier this week, we sent them our first set of policy recommendations that would make real, meaningful steps towards reforming our broken justice system that has subjected thousands of people to cruel and inhumane treatment.
But first, lawmakers, media, and the public need to recognize the full picture of incarceration trends, including the past two years.
Alabama Department of Corrections, January 2012 - June 2019
*Data from ADOC Monthly Reports
| In-custody | Released, total custody (monthly) | Released, on parole (monthly) | Admissions, custody (monthly) | Difference bw admissions/ releases | Percent change in custody, by year | |
|---|---|---|---|---|---|---|
| January 2012 | 26549 | 628 | 165 | 769 | 141 | -0.31% |
| February 2012 | 26682 | 682 | 200 | 722 | 40 | 0.20% |
| March 2012 | 26684 | 675 | 224 | 943 | 268 | 0.92% |
| April 2012 | 26731 | 678 | 225 | 626 | -52 | 0.94% |
| May 2012 | 26710 | 691 | 260 | 743 | 52 | 0.86% |
| June 2012 | 26738 | 647 | 201 | 751 | 104 | 0.56% |
| July 2012 | 26827 | 689 | 245 | 719 | 30 | 0.93% |
| August 2012 | 26828 | 756 | 250 | 766 | 10 | 0.96% |
| September 2012 | 26762 | 656 | 197 | 613 | -43 | 0.60% |
| October 2012 | 26715 | 702 | 253 | 742 | 40 | 0.42% |
| November 2012 | 26760 | 711 | 239 | 599 | -112 | 1.01% |
| December 2012 | 26629 | 665 | 217 | 625 | -40 | 0.10% |
| January 2013 | 26690 | 625 | 187 | 794 | 169 | 0.53% |
| February 2013 | 26693 | 639 | 176 | 621 | -18 | 0.04% |
| March 2013 | 26662 | 691 | 241 | 737 | 46 | -0.08% |
| April 2013 | 26568 | 779 | 296 | 739 | -40 | -0.61% |
| May 2013 | 26584 | 684 | 220 | 772 | 88 | -0.47% |
| June 2013 | 26576 | 665 | 185 | 619 | -46 | -0.61% |
| July 2013 | 26618 | 677 | 202 | 774 | 97 | -0.78% |
| August 2013 | 26653 | 712 | 239 | 762 | 50 | -0.65% |
| September 2013 | 26604 | 734 | 261 | 698 | -36 | -0.59% |
| October 2013 | 26511 | 643 | 192 | 636 | -7 | -0.76% |
| November 2013 | 26493 | 611 | 165 | 580 | -31 | -1.00% |
| December 2013 | 26502 | 709 | 246 | 785 | 76 | -0.48% |
| January 2014 | 26427 | 644 | 170 | 593 | -51 | -0.99% |
| February 2014 | 26428 | 597 | 154 | 606 | 9 | -0.99% |
| March 2014 | 26398 | 744 | 291 | 749 | 5 | -0.99% |
| April 2014 | 26316 | 684 | 228 | 665 | -19 | -0.95% |
| May 2014 | 26222 | 712 | 232 | 652 | -60 | -1.36% |
| June 2014 | 26265 | 646 | 211 | 713 | 67 | -1.17% |
| July 2014 | 26060 | 752 | 278 | 617 | -135 | -2.10% |
| August 2014 | 26140 | 687 | 213 | 748 | 61 | -1.92% |
| September 2014 | 26029 | 732 | 220 | 640 | -92 | -2.16% |
| October 2014 | 26091 | 569 | 128 | 683 | 114 | -1.58% |
| November 2014 | 25961 | 668 | 251 | 551 | -117 | -2.01% |
| December 2014 | 25894 | 715 | 253 | 685 | -30 | -2.29% |
| January 2015 | 25932 | 573 | 181 | 648 | 75 | -1.87% |
| February 2015 | 25835 | 653 | 217 | 540 | -113 | -2.24% |
| March 2015 | 25625 | 752 | 284 | 649 | -103 | -2.93% |
| April 2015 | 25699 | 606 | 185 | 706 | 100 | -2.34% |
| May 2015 | 25687 | 653 | 196 | 669 | 16 | -2.04% |
| June 2015 | 25606 | 671 | 231 | 610 | -61 | -2.51% |
| July 2015 | 25447 | 726 | 237 | 632 | -94 | -2.35% |
| August 2015 | 25416 | 599 | 183 | 546 | -53 | -2.77% |
| September 2015 | 25201 | 680 | 246 | 559 | -121 | -3.18% |
| October 2015 | 25241 | 641 | 184 | 675 | 34 | -3.26% |
| November 2015 | 25047 | 672 | 217 | 491 | -181 | -3.52% |
| December 2015 | 24955 | 643 | 194 | 608 | -35 | -3.63% |
| January 2016 | 24937 | 615 | 204 | 654 | 39 | -3.84% |
| February 2016 | 24769 | 633 | 252 | 516 | -117 | -4.13% |
| March 2016 | 24736 | 709 | 237 | 731 | 22 | -3.47% |
| April 2016 | 24686 | 740 | 186 | 674 | -66 | -3.94% |
| May 2016 | 24536 | 784 | 288 | 655 | -129 | -4.48% |
| June 2016 | 24380 | 706 | 205 | 628 | -78 | -4.79% |
| July 2016 | 24203 | 744 | 203 | 561 | -183 | -4.89% |
| August 2016 | 24050 | 814 | 303 | 709 | -105 | -5.37% |
| September 2016 | 23759 | 878 | 290 | 629 | -249 | -5.72% |
| October 2016 | 23495 | 901 | 355 | 642 | -259 | -6.92% |
| November 2016 | 23455 | 711 | 218 | 781 | 70 | -6.36% |
| December 2016 | 23376 | 901 | 306 | 831 | -70 | -6.33% |
| January 2017 | 23164 | 732 | 278 | 575 | -157 | -7.11% |
| February 2017 | 23087 | 716 | 291 | 571 | -145 | -6.79% |
| March 2017 | 22824 | 798 | 313 | 728 | -70 | -7.73% |
| April 2017 | 22624 | 930 | 457 | 730 | -200 | -8.35% |
| May 2017 | 22313 | 1015 | 489 | 821 | -194 | -9.06% |
| June 2017 | 22201 | 849 | 362 | 789 | -60 | -8.94% |
| July 2017 | 21868 | 861 | 384 | 472 | -389 | -9.65% |
| August 2017 | 21616 | 898 | 356 | 754 | -144 | -10.12% |
| September 2017 | 21563 | 864 | 308 | 814 | -50 | -9.24% |
| October 2017 | 21509 | 817 | 308 | 847 | 30 | -8.45% |
| November 2017 | 21511 | 824 | 300 | 835 | 11 | -8.29% |
| December 2017 | 21524 | 763 | 219 | 756 | -7 | -7.92% |
| January 2018 | 21357 | 852 | 339 | 748 | -104 | -7.80% |
| February 2018 | 21127 | 882 | 405 | 669 | -213 | -8.49% |
| March 2018 | 21056 | 846 | 323 | 788 | -58 | -7.75% |
| April 2018 | 20828 | 1069 | 501 | 806 | -263 | -7.94% |
| May 2018 | 20762 | 838 | 323 | 892 | 54 | -6.95% |
| June 2018 | 20707 | 852 | 306 | 780 | -72 | -6.73% |
| July 2018 | 20670 | 874 | 309 | 893 | 19 | -5.48% |
| August 2018 | 20615 | 1030 | 459 | 1001 | -29 | -4.63% |
| September 2018 | 20585 | 865 | 391 | 806 | -59 | -4.54% |
| October 2018 | 20691 | 813 | 268 | 980 | 167 | -3.80% |
| November 2018 | 20786 | 720 | 187 | 827 | 107 | -3.37% |
| December 2018 | 20855 | 653 | 162 | 744 | 91 | -3.11% |
| January 2019 | 20830 | 716 | 232 | 718 | 2 | -2.47% |
| February 2019 | 20972 | 607 | 198 | 779 | 172 | -0.73% |
| March 2019 | 21013 | 828 | 252 | 890 | 62 | -0.20% |
| April 2019 | 21119 | 703 | 195 | 866 | 163 | 1.40% |
| May 2019 | 21257 | 720 | 174 | 895 | 175 | 2.38% |
| June 2019 | 21346 | 734 | 182 | 813 | 79 | 3.09% |